Use-Case #1 - Investigate Vessels in Polygon by Risk
| This document aims to provide a brief description of a specific workflow within Windward’s platform. Keep in mind that a full integration process will enable your organization to build custom workflows and implement a wide range of use-cases tailored to individual needs of different stakeholders (analysts, operators, IT, developers etc.). To learn more about backend integration flow, follow this link. |
|---|
Sara, an analyst working for a major shipment company, intends to conduct a risk assessment of a designated operational area. Following this, she will undertake a detailed examination of selected vessels comprising the company's fleet.
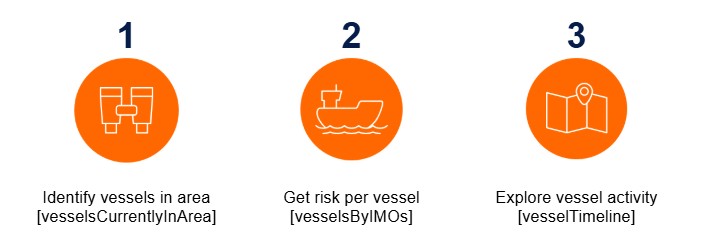
| Step 1 | Step 2 | Step 3 |
|---|---|---|
| Identify vessels in area [vesselsInArea] | Get risk per vessel [vesselsByIMOs] | Explore vessel activity [vesselTimeline] |
Step by step investigation process
Starting with the initial authentication, steps 1-12 are covering the creation of a valid token in the platform which will be used to run the queries. If you are already familiar with these steps skip ahead to step #13.
- Login to the company’s Windward account (GraphQL environment) - user and password to your project (link)
- Once in GraphQL, select “explorer” from the left-side menu
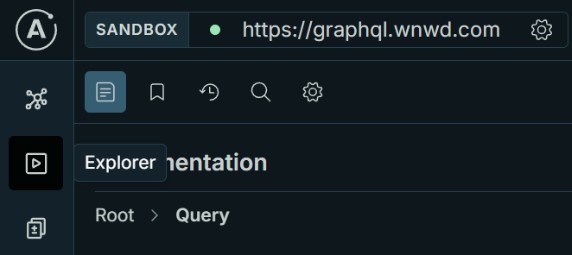
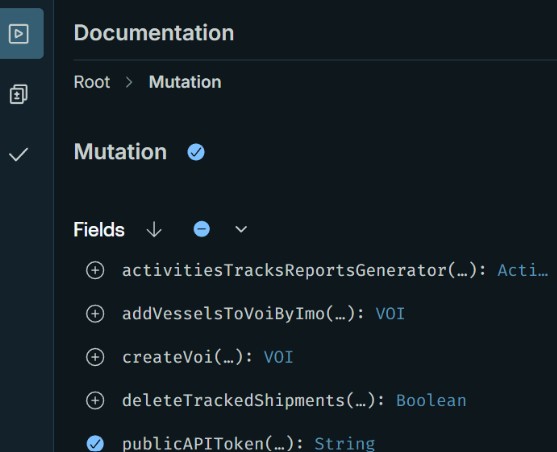
- Navigate to Root > Mutation
- Select the publicAPIToken
-
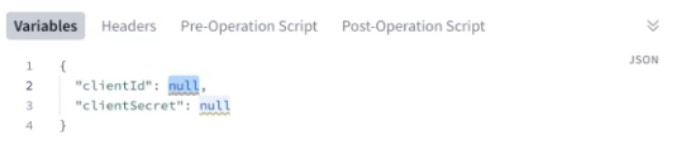
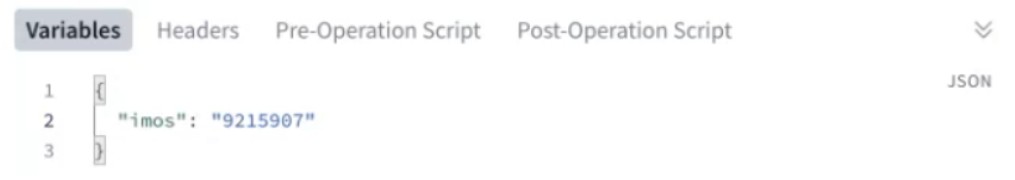
The top section of the screen will show the relevant operation being performed, while the lower section “Variables” tab will indicate which parameters are being injected to this request. The two fields listed are “clientId” and “clientSecret” (which will be provided in advance by our support team).
-
Paste the values for the two above mentioned fields, replacing the default “null” value.
-
Run the mutation using the Play button at the top of the main section

- On the right section, a response will be presented according to the parameters provided. Copy the value of the “publicAPIToken” marked in blue (ignoring the quotation marks at the beginning and end of the string).
You may also switch to table view instead of the raw Json to easily copy the token value.
Note that this Token is valid for 15 minutes only, so if needed, repeat the step #7 above to generate a new Token. It is advised to keep the “Mutation” tab open at this point in case you need to run it again. Click the “+” icon to the right of the tab to open a “New Workspace” for your next query.

| 💡Once the integration process is completed, there will be no need to manually refresh the Token. This authentication process should be designed as a dedicated method to meet industry best practices. |
|---|
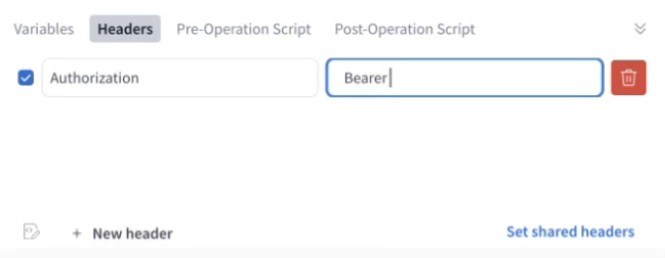
- In this new workspace, select the lower tab for “headers”, then click “+ New header” on the lowest section. Two fields will appear in order to define the header structure.
- On the left field select “authorization” from the drop-list.
- On the right field enter “Bearer “ and paste the Token copied in step #8. (make sure there is a single space char between these two strings).
- Switch back from “Headers” tab to “Variables” tab.
Execute a sequence of queries
You are now ready to build your query by selecting relevant fields of data.
-
On the left section, under the “Root types” label, click the “+” icon next to the “query” label. This will unravel a list of all available endpoints in Windward’s platform.
-
The following suggested endpoints are given as an example of a basic business logic workflow. This use-case is one of the many ways a sequence of queries can be used to gain critical insights delivered directly to any external system via webhooks:
- vesselsCurrentlyInArea - identify vessels operating in a specific area based on AIS transmissions and assessed risk.
- vesselsByIMOs - pull risk assessment details for a vessel based on IMO (or by MMSI using a similar endpoint named vesselsByMMSI) .
- vesselTimeline - get detailed activity which correlates to the provided risk assessment of the vessel.
-
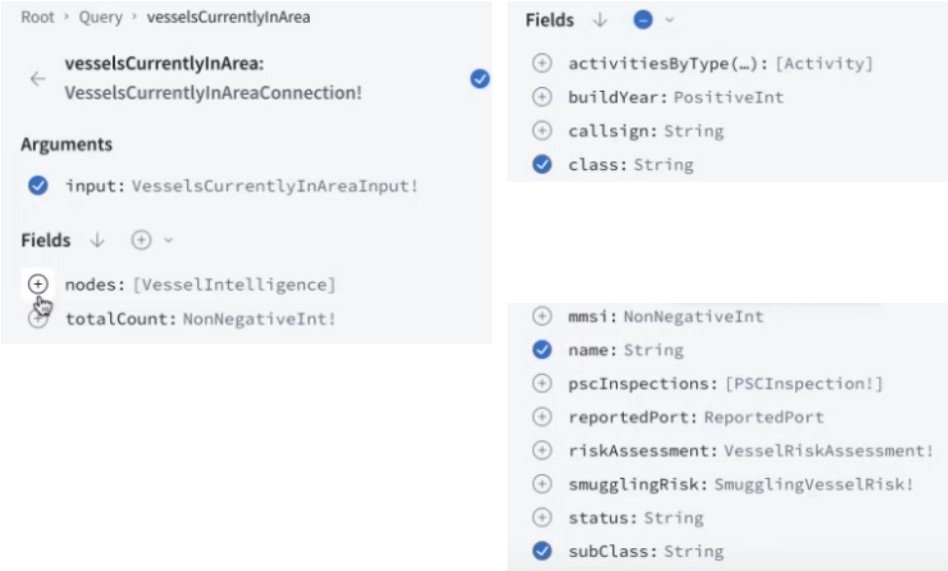
Select the first endpoint - “vesselsCurrentlyInArea”. Note that the query section is missing critical input and therefore can not be executed at this point.
-
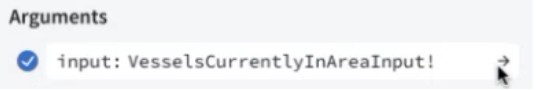
In order to fill in values for input, click the arrow icon next to the selected argument.
-
The left section will show a list of input fields:
- Area - define by geo coordinates or a polygon name
- Limit - define a maximum number of results in the response
- Offset - pagination option for multiple results
-
Select “area”

| Notes on Geolocation polygon syntax: |
|---|
| Visit https://windward.ai/ > API insights Lab > Technical Documentation |
| Find the relevant section on the left menu (for example “Behavioral analysis”) and expand the related queries for it. Click a specific query you would like to explore, and view the sample query syntax. You may want to copy the structure of the “Variables” JSON and use it as a guide to build your own query in Windward’s platform. Note that when a syntax is pasted into the Variables section of the UI, input fields will be selected/unselected accordingly. You can either delete a specific parameter manually or unselect it on the “Input Fields” list on the left. The result will be the same. |
- “Fields” sub-section will define the structure of the data in the response. Click the “+” icon next to “nodes” in order to select the list of fields within the response.
- Edit the “timeRange” values (from..to…)
- Make sure the query is edited properly:
- “Operation” section (which fields are required as output format)
- “Variables” section (what are the input parameters by which data should be filtered by the endpoint)
- Execute the query

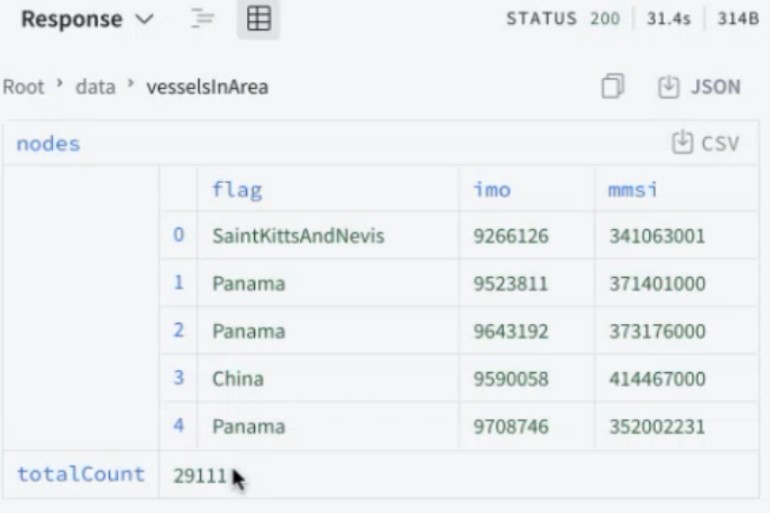
- Response will be shown within a few seconds of the right panel (Json/Table view)
Now that you have a list of IMOs in a given location, use the “vesselByIMOs” endpoint to gain additional information.
- Repeat steps #8 if you need to refresh your Token at this point, and paste it in the header bearer field.
- Select a new endpoint labeled “vesselByIMOs”
- As in the previous query, edit both “Operation” and “variables” sections, by selecting the desired fields and editing their syntax in the middle section of the screen.
- Basic fields to consider for output: class, flag, IMO, MMSI, name, subclass
- Additional fields suggested: riskAssessment (based on different risk models):
- complianceRisk: sanctions evasion
- iuuFishingRisk: illegal fishing
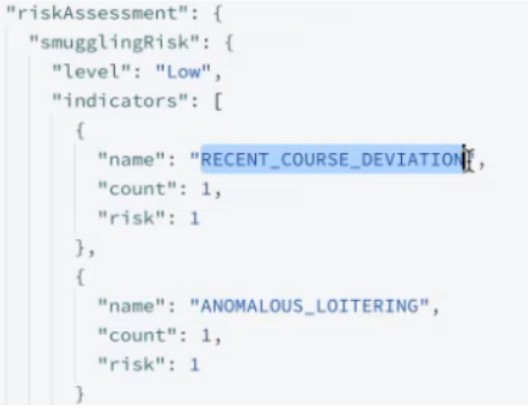
- smugglingRisk: Smuggling involvement
Note that different parameters will include different sub-items / structures.
- Use the IMOs provided as a result for the initial query (step #24) as input Variables for the current query. So far you have detected a list of vessels in a specific area and now you can continue by exploring risk related information per IMO (or an array of IMOs).
- Run the query to get IMO data structure
- Response section will show related activity for that vessel which is the root cause of the smuggling risk associated with it. Note that the level of risk is also provided for each of these risk building-blocks (?) and a cumulative risk score will be compared to a designated threshold (based on the risk appetite defined for your environment/project).
| Notes: |
|---|
| Risk levels are defined as “Low” / “Moderate” / “High”. Their distribution is generally top 5% for “Moderate” and top 2% for “High” risk. |
- Further exploration of the IMO may include a detailed timeline for the vessel. Open a new query tab (and make sure the header information still contains a valid bearer token).
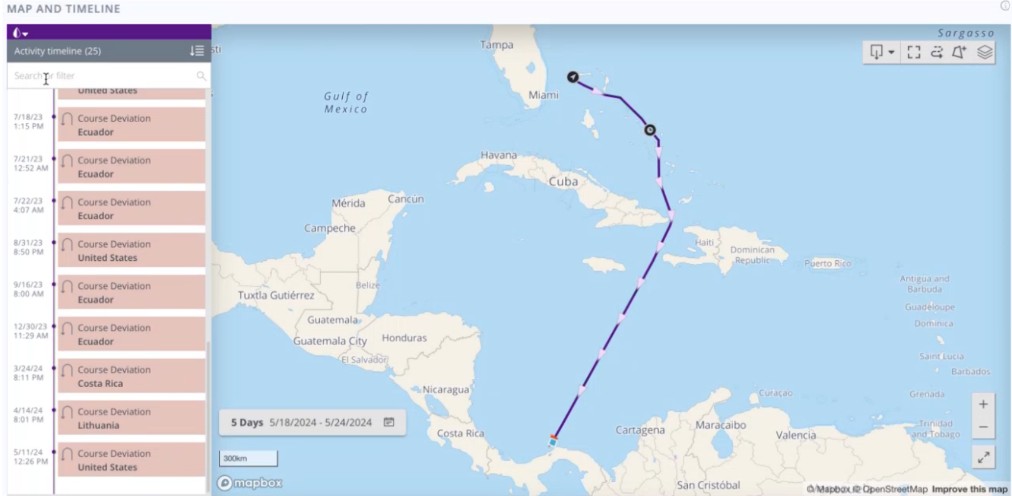
A reference to the timeline representation in the Webapp:
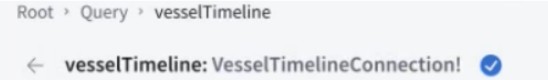
- Select an endpoint labeled “vesselTimeline” from the query list on the left.
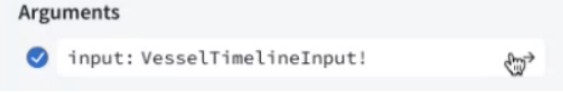
- To define the arguments for input, under “Arguments” section click the arrow icon
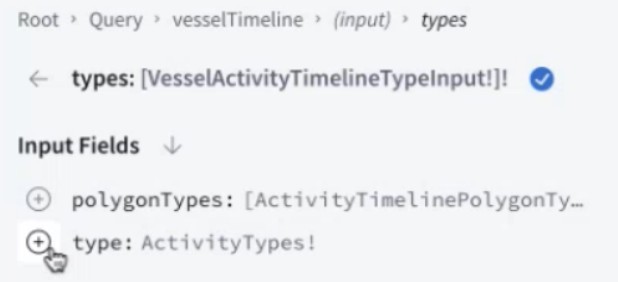
- Repeat the selection of input fields, drill down to additional subsets such as “type” by selecting its “+” icon and define values in the “arrow” icon.
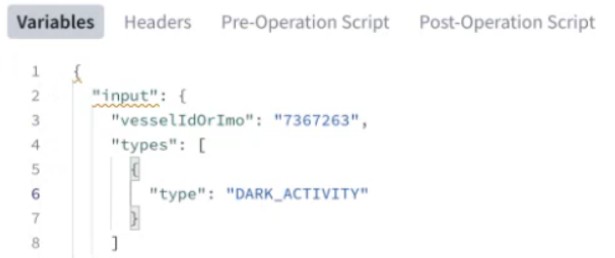
- When a list of values is shown for a specific field, you can copy and paste it directly into the “variables” editor (for example “DARK_ACTIVITY” in line 6 below).
- When defining any additional input field, make sure you use the suggested format as shown in the description of the field. For example, timeRange from/to is represented in the following syntax:
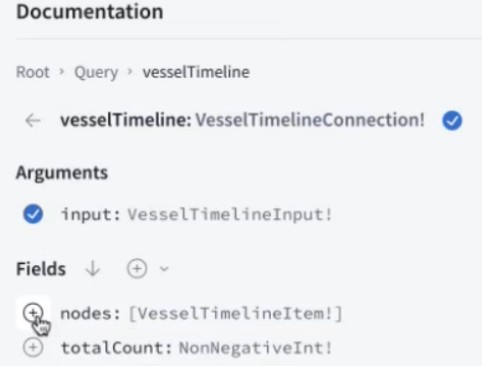
ISO Format "YYYY-MM-DD[T]HH:mm:ss[Z]", example "2022-01-01T00:00:00Z" - Use the breadcrumbs to navigate back to the endpoint level once your input fields are defined, and select the “+” icon next to “nodes” in order to define the response structure.
- Suggested fields you may want to consider are:
- Type
- startDate
- endDate
- startCoordinate
- endCoordinate
- Duration
- Click the blue play button to execute the query [ ▶ VesselTimeline ] and examine the response payload on the right section.
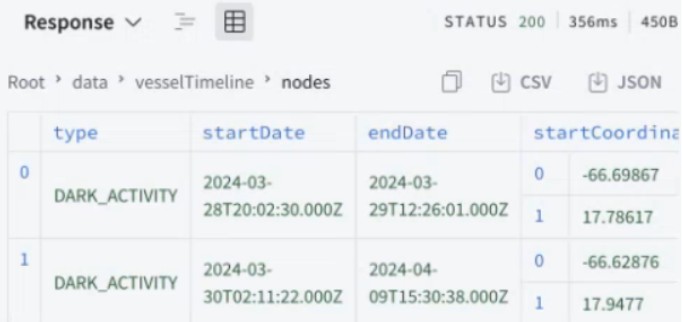
- Typical response time should be a few seconds for most queries, with a maximum of ~120 seconds for data-rich or complex queries. You may consider the request status as timed-out if no response is shown beyond that.
- Troubleshooting information if available at the developers’ site, including Status and Error Codes descriptions. At any point, Windward’s teams are always available to assist.
- For Token validation you may paste your string at https://jwt.io/ and review the key properties including expiration timestamp.
Using the web application to trigger webhooks
When using the web UI, similar queries can be saved and set to trigger alerts. Any new data within the defined criteria will trigger an email and/or a webhook. Each webhook is linked to a specific payload structure, so multiple webhooks can be used in parallel to combine various data-points into a comprehensive data set on your platform.
Follow these steps to set it up as an example:
-
Define a search (for example by IMO)
-
Define additional parameters and filters to the query
-
Save query
-
Create an alert, choose both email and/or in-app-notification
-
Submit a request to the customer success team to set up the following:
- Define a webhook URL (on your system)
- Define filters
- Define related parameters
- < trigger sample event ? >
(*) if your subscription is for API only and does not include webapp access, submit a request for customer success to set this up.
-
Examine the pre-defined payload structure in your system/database
-
Monitor the integration in production to ensure smooth operation
| Helpful tip💡: |
|---|
| An API response can also include a quick-access URL to a “vessel profile page”. This URL can provide a read-only time-limited access to the full details of any vessel, including all webapp components (Mapview, timeline, Risk, ownership etc.). See more details here |
.